New Jersey Ozone/WNV, 2001
New York City and State DOHs no longer publish detailed WNV activity data as they did in 2000, so data from adjacent New Jersey was used. Ozone data is obtained from the NYSDEC's Susan Wagner monitor station, in Staten Island, NY, which is adjacent Middlesex Cty, NJ, the 2001 epicenter for the tri-state region.
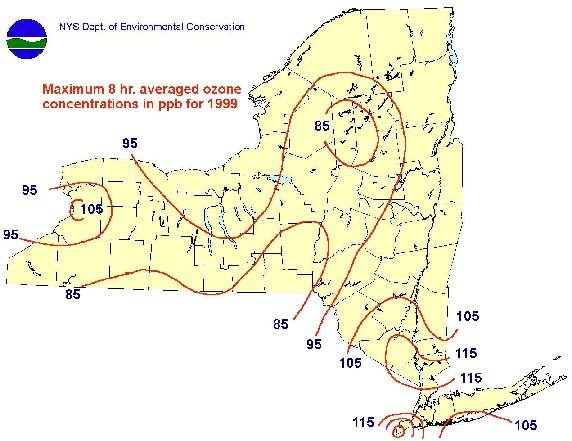
Middlesex County is south of Bayonne and Elizabeth refineries, and Chevron's Perthy Amboy refinery is situated in the NE part of that county, just off the tip of Staten Island. Staten Island, the prominent WNV epicenter in NYS is just west of the three refineries. Record high ozone readings for NYS are annually occur near the Perth Amboy area (see ozone map, 1999). The area around Edison, NJ contains chemical companies and refineries like Chevron, Exxon, Mobil, Amoco, and is located in the second largest petrochemical region in the U.S. Through the Delaware Estuary, which encompasses this region, passes 70% of the NE US Atlantic Coast oil market.
The Delaware Estuary includes the world’s largest freshwater port (Port of Philadelphia), the nation’s second largest petrochemical center, and several major population centers. For these and other reasons, the Estuary is vulnerable to human disturbance. Approximately 70 percent of the oil arriving on the Atlantic Coast is transported through the Estuary, placing the region at great risk from harmful oil spills. The Delaware Estuary supports a wide range of plants and wildlife, including oysters, crabs, sturgeon, region at great risk from harmful oil spills. The Trenton-Wilmington area has the world’s greatest concentration of heavy industry. -- DNREC
West Nile virus activity is derived from online press releases from the NJDOH (New Jersey Dept. of Health).
Ozone is an indicator of the air pollution data complex and is employed throughout this study because it is currently the only available real-time air data for Staten Island, and generally the most available air data.
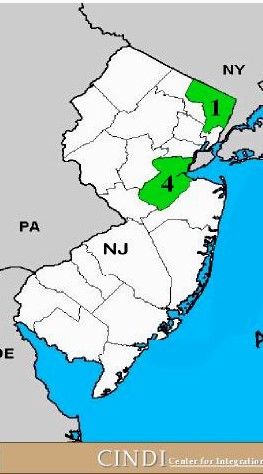
New Jersey Year 2001 Counties Map (8/9/01)
With Oil Refineries Designated
I believe that I have all the major NJ oil refineries designated below (blue circles). There are also numerous chemical corporations associated with the refineries, and there is an 810 megawatt out-of-compliance power plant in Camden, not designated. Gloucester County is aberattive in terms of WNV positives, though it is adjacent to Camden. There are reporting factors, media awareness, and testing/pickup protocols, which may vary in the counties.
The NJ year 2000 Counties map, is similar to the 2001 map above, though WNV testing was not as thoroughly implimented until fed grants enabled that, in year 2001.
USGS Map (2001) of New Jersey
WNV Postive Wild BirdsThe most dense WNV epicenter is the township of Edison in Middlesex County, west of Staten Island, amidst many chemical companies, the Bayway refinery in Linden, and the Chevron asphault refinery in Perth Amboy. By July 27, 2001 the NYS DOH discontinued providing township and date found for WNV positive birds. The NJ DOH only then provided general numbers of WNV positives since the last reporting date and the county. Nevertheless, while the township was provided, the township of Edison, Middlesex County frequently can be found on the DOH website.
WNV Birds Accumulative : USGS/CDC WNV Counties Map May 23, 2001 August 6, 2001
The above maps are online through links to the NJDOH website.
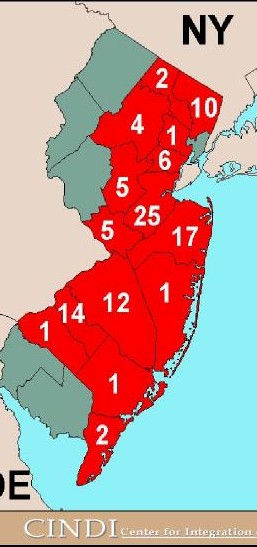
Airnow map (5/3/01) with WNV accumulative bird data
up to 7/27/01, for New Jersey only
The following map is a modified EPA Airnow map with added WNV data labelling from the NYSDEC. These EPA maps can be found in calendar format, including all WNV activity, such as bird death, human, equine, and collected/positive mosquito pools. See May 3rd, 2001, from which the following map is located. WNV positives up to 7/27/01 are shown below for New Jersey counties with substantial reporting. About 30 other WNV positives are scattered throughout other nearby NJ counties.
Middlesex and Monmouth are clearly the epicenter for the tri-state region. NYS has few WNV positives. December 11, 2000 at the Conference for Emerging Diseases in NYC, this observation was stated to the incredulous medical panel (Cohen NYCDOH; Layton, NYCDOH), and McNamara, Bronx Zoo), that the east NJ oil refinery region was the epicenter for WNV positives and bird death.
Susan Wagner air monitoring station data is also available in calendar format.
Graph Generated 7/27/2001
"One need only look at the number of hospitalizations on high-ozone days to justify the higher standard." -- Bob Shinn, NJ DEP Commissioner
Future graphs will be difficult to generate because New Jersey DOH has discontinued detailed reporting. WNV positives are, after 7/27/01, only reported en masse, and with no details. However, NYCDOH does give detail but NYC has downplayed WNV publicity so there is relatively little reporting, as of 8/9/01.
Analysis of Graph
Item Correlations Comment Peaks and Valleys Correlates one-to-one for every peak and valley. The fundamental correlation exists.
This is also found in the year 2000 graph.Synchronicity Correlates, however, ozone levels often follow WNV activity. Correlates but causative contradiction. Ozone follows WNV activity, especially in the early part of the summer. This is seen in year 2000 data. If ozone is the causative agent then it would be expected to lead. Three facts explain this: 1) Ozone is an indicator of the larger complex of air pollution. 2) Ozone is a reaction product to air pollution and therefore follows the larger complex of air pollution (see ozone sources in footnotes). 3) Ozone, being a product of sunlight UV reactions, is not at ground level as often as soon as other pollutants.
This is also found in the year 2000 graph.Amplitude Correlation is not obviously consistent in the early months. The effects of air pollution on health are cumulative, thus accounting for lack of amplitude consistency during the early summer. Amplitude correlates, however, in terms of cumulative sensitivity on the part of the animals, and this correlation becomes more visually obvious as the summer progresses.
This also is found in the year 2000 graph.Essentially, the basic correlation (peaks and valleys) correlate strongly. Synchronicity and amplitude are ther, but are slow starters, correlating more strongly as the summer progresses. These items are also found in the year 2000 graph and the Staten Island Refuge year 2000 graph.
Ozone is a natural reaction product to pollution caused by sunlight's ultraviolet light disassociating O2 and oxides and forming O3 (ozone). This occurs more efficiently when air is polluted and when sun enters the atmosphere at a sharp angle (from 90 degrees), such as during the summer from noon through 5pm. Ozone also works the reverse reaction, combining with the pollutants to form nitrous oxides, NO, NO2, NOx, sulfides, etc.
Thus ozone indicates air pollution and serves as an oxidative, reversible "energy spring" for the pollution complex, storing the energy of the ultraviolet light.
WNV Forecast: 7/27/01
Increasing WNV activity through July, as seen in the ozone patterns in the above graph.
Increasing WNV activity until the end of September, based upon graphs from year 1999 and 2000.
More reporting for NJ because of increased funding and improved labs and reporting protocol in year 2000.
Less bird reporting for NYC because of greatly reduced publicity. NJ is rarely mentioned in NYS media, even though the NJ epicenter is adjacent to the NYC epicenter for 2000 (Staten Island).
The ozone pattern in the last generated graph provides a forecast for future WNV activity, which will be confirmed on the next graph that will be provided as soon as more data is available.
Air Chemistry Sources
http://www.ldeo.columbia.edu/dees/U4735/lectures/13/13.html
http://www.epa.gov/oar/oaqps/greenbk/o3co.html
http://www.eq.state.ut.us/eqamc/no2.htm
http://www.ceroi.net/reports/durban/issues/air/pollutan.htm
Thanks to Bryan Foster for additional research and ideas on air chemistry.
![]()