Data Coverage
The weekly data for the three years of 1997-1999 were entered into a spreadsheet, for the period of 8/27 to 10/29. This encompasses the period of pesticide spraying (by helicopter and truck) of all boroughs of New York City. Each entry date represents the week ending date.
It would have been preferable to include more years for comparison, however, this is what the NYC VS provides, for a single sheet view, and it does give a sufficient perspective of the present against the past for this initial study. Others are encouraged to analyse the data.
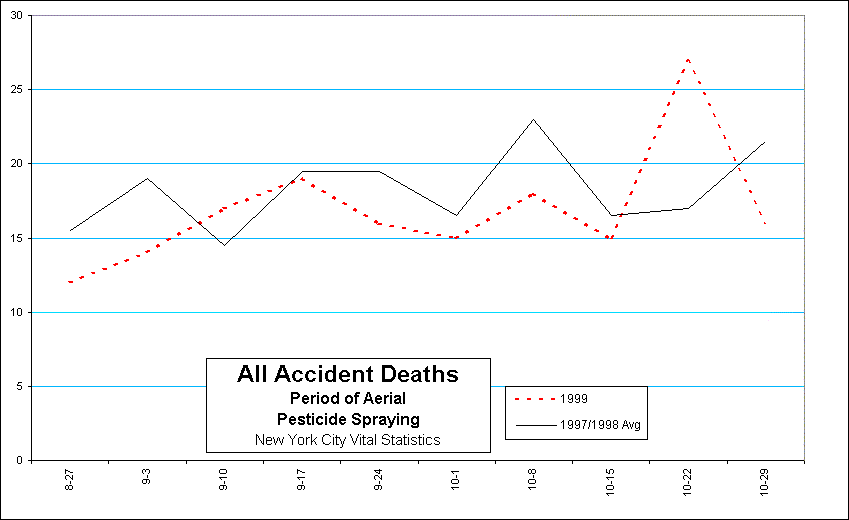
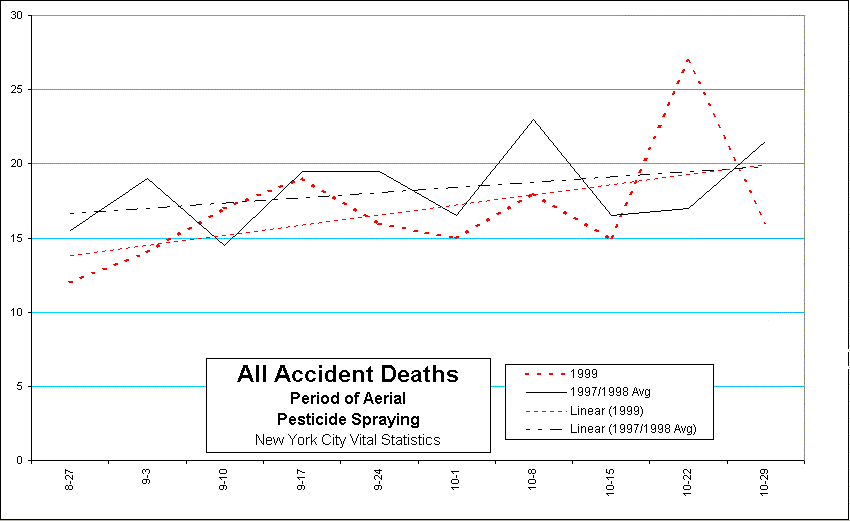
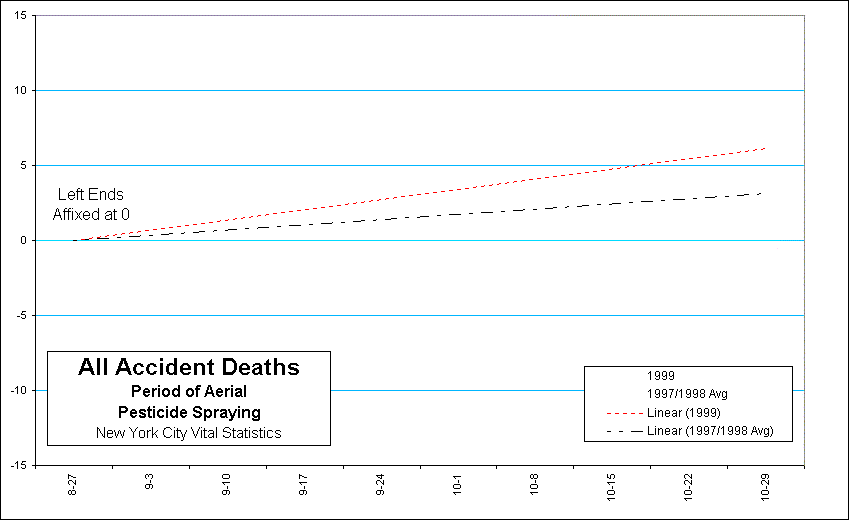
In previous releases of this evaluation of the NYC VS, incidence was used. Usually, incidence is preferred because it incorportates changing populations. Hoever, for this study I've decided that it is not preferable, because NYC is not experiencing large population shifts, and also, the city does not always update incidence numbers, leaving blanks. A dotted line represents 1999, and a solid line represents the average of 1997/1998. A trendline (default settings) is generated for each line. The trendlines reduce the jagged lines to a straight line, simplifying the view.
Evaluation Method
I'm not a medical authority, however, common sense, an education in engineering, chemistry, and higher mathematics (calculus and statistics), and decades of trying to look at medical data objectively, leads me to believe this method of evalution to be correct. The method is described:
1) Generally, the overall height relation between the two trendlines should be ignored because the most important aspect is not relative mortality, but the relative acceleration of mortality during the given period. In other words, for instance, it is unimportant if 1999 mortality is generally below the 1997/1998 average for any given category.
2) Generally, decline and incline directions of individual trendlines are unimportant and should be ignored, because, again, it is the relation between trendlines, not their directions, which is critcally important.
3) The important indicator: The angle created between the two trendlines represents the relative change of mortality during the spray period (see Step 5, below). Even if both trendlines were to be moving downward, one would find that an angle is created, and that this angle would show an adverse effect during the spray period for most categories (except HIV and TB). Live births shows a negative trend. HIV is unique because its definition is strongly disputed (See www.duesberg.com or www.virusmyth.com). HIV mortality has been falling for several years.
Developing The "Evaluation View": 5 Steps
The category "All Accidents" is used for this example.
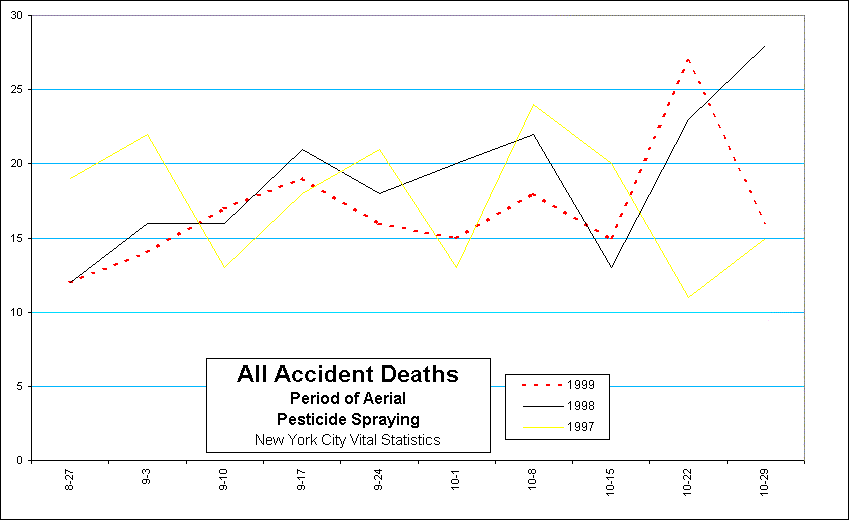
Step 1. The data is displayed graphically for the years 1997, 1998, and 1999, for the weeks surrounding the spray period.
Step 2. The 1997 and 1998 data are averaged together to create a single line (1997/1998Avg) which represents the past, against which 1999 can be compared.
Step 3. A trendline is created for 1999, and a trendline is created for 1997-1998 Average.
Step 4. Plotted lines are removed, leaving only the trendlines.
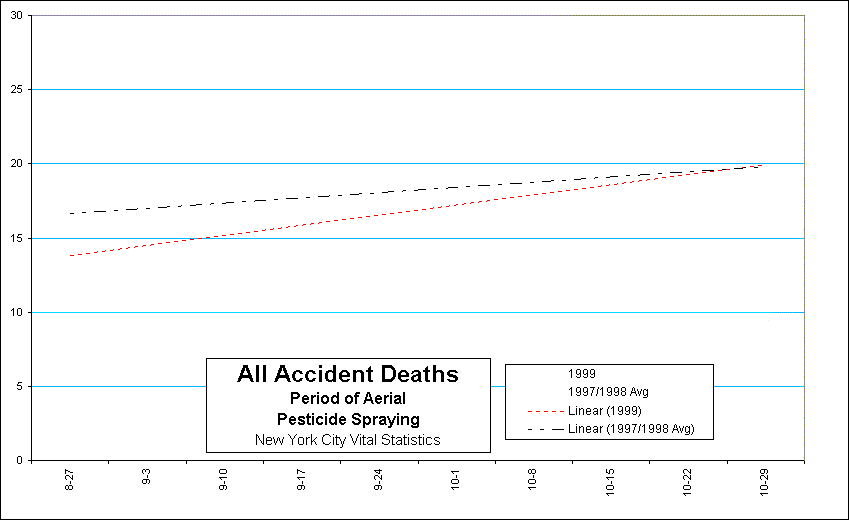
Step 5. The trendlines are affixed at 0 at their left ends, and the Y-axis values are regarded as relative values. This is the evaluation view. The pair of trendlines now shows the relative change of mortality during the pesticide spray period.
Criticism
Herein, the fundamental experience of New Yorkers during the malathion spray programs is most simply portrayed in terms of the expectations of many environmentalists. These results are also presumably in accordance to the expectations of health officials in Japan, where malathion was banned as of 1960 (1) -- and with the more recent findings of Dr. Omar Shafey, the Florida state epidemiologist who was given the task of evaluating the health risks of malathion spraying in Florida. Dr. Shafey's reports, which were not favorable towards the application of malathion on mass populations and were repressed. He is seeking other employment. (2) Over 100,000 persons are engaged in a lawsuit in Tampa regarding health dysfunctions alleged to have incurred as a result of pesticide spray programs. (3) Over one hundred of these cases have been officially confirmed by the state of Florida.
There is no manipulation of data or sophisticated transformations. Presumably, criticism would require complications of theory and data to be successful, and that in itself would be evidence of a weakness. The only criticism that I can find is that it is possible that the frames of reference are not objective choices. The reader might try shifting the view frame a week or two to see other interpretations. For instance, removing the "extra" last week (10/29/99), another view frame (8/27 to 10/22), shown herein, also provides a strong argument for environmentalists, i.e., a wider angle showing increased mortality in most categories during the spray period in 1999. In both view frames, total death, pneumonia/flu, all accidents, and motor vehicle accidents show accelerated death rates.
More Information
www.greens.org/ny/stop-spraying
www.chem-tox.com Studies.
www.freeyellow.com:8080/members8/armm Ongoing activities, including the NYC community board proposal campaign, organized by Elizabeth Shanklin (elizs@earthlink.com) is described therein.
"NoSprayNews": An emailed newsletter sent out by the Coordinator of the NoSpray Coalition (Green Party), Mitchel Cohen. Email him, to be on the list, at mitchelcohen@mindspring.com
www.garynull.com/issues Activities, representatives, and contact lists.
Footnotes
| 1) | Gaylord Jones, environmental lawyer (New Orleans, LA.), in a speech given 11/6/99, at the "Community Forum on the Spraying of New York", hosted by The National Action Network and Reverand Al Sharpton. |
| 2) | Memo retrieved by FOIL, forwarded by Joyce Shepard to NoSpray Coalition Coordinator, Mitchel Cohen. |
| 3) | Associated Press Online, May 28, 1999. |