Ozone levels data are from the Susan Wagner monitor station, which the NYSDEC established in Staten Island, NY. They are represented as ppm on the Y-axis.
West Nile virus activity is derived from all announcements from the NYCDOH, regarding New York City. This is represented on the Y-axis as a simple factor (0.004 x daily event reports).
I. Detail Is Useful But Somewhat Confusing
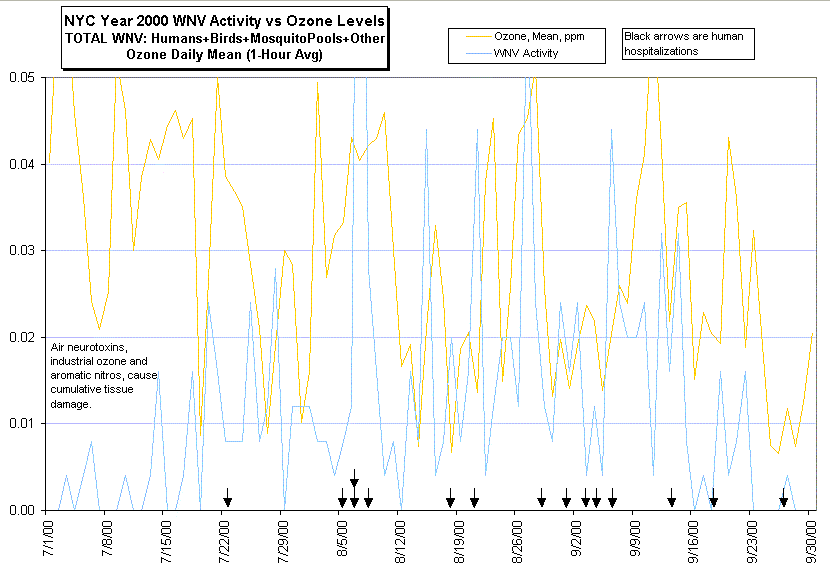
Though confusing, this is interesting. At this daily level, animal activity responds upward immediately at the lower beginning of an upward bound ozone line. There is sometimes a double peak in the animal activity within a single ozone peak.
II. Detail Is Smoothed With 3-Day Moving Average
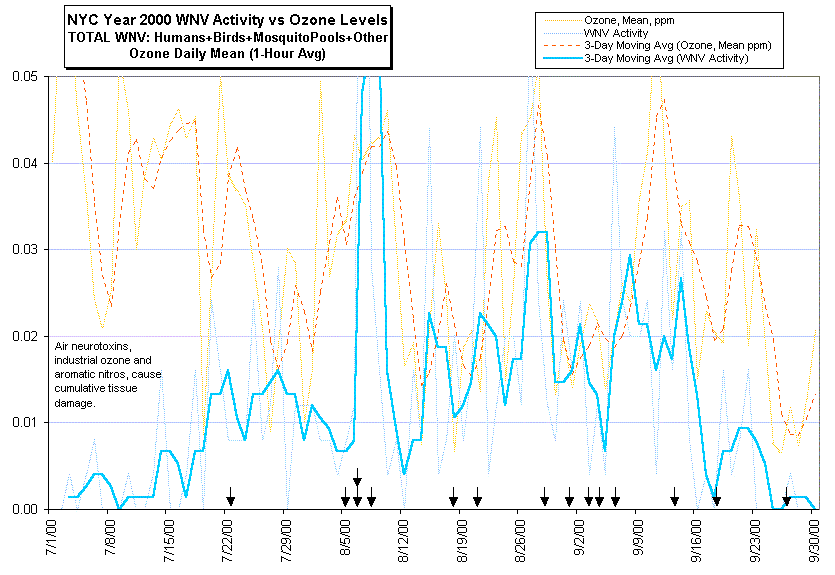
Note: Moving averages from 2 days to 21 days were tested. The 3-day moving average was preferred because it smoothed the detail, making it less confusing, yet maintained detail, for accuracy. None of the tested moving averages contradicted the correlations.
III. Detail Is Hidden
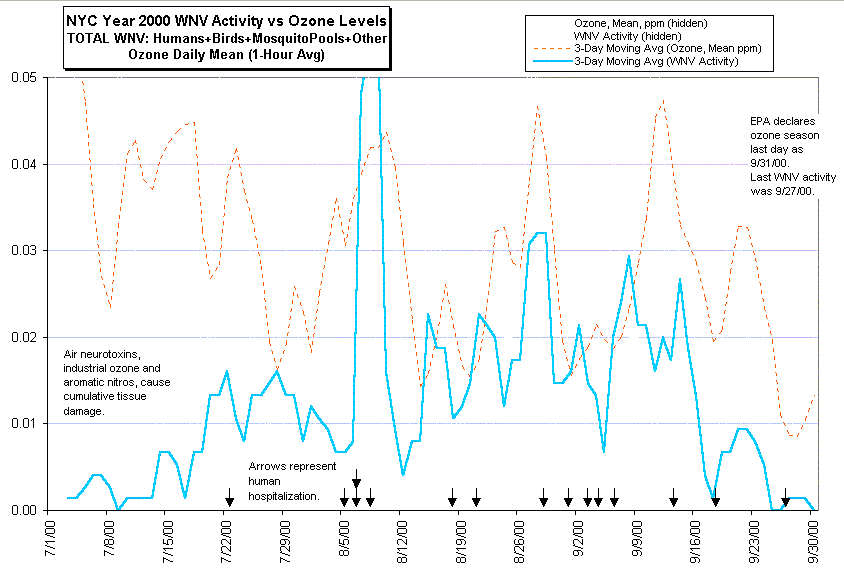
IV. All Peaks and Valleys Matched
Comment
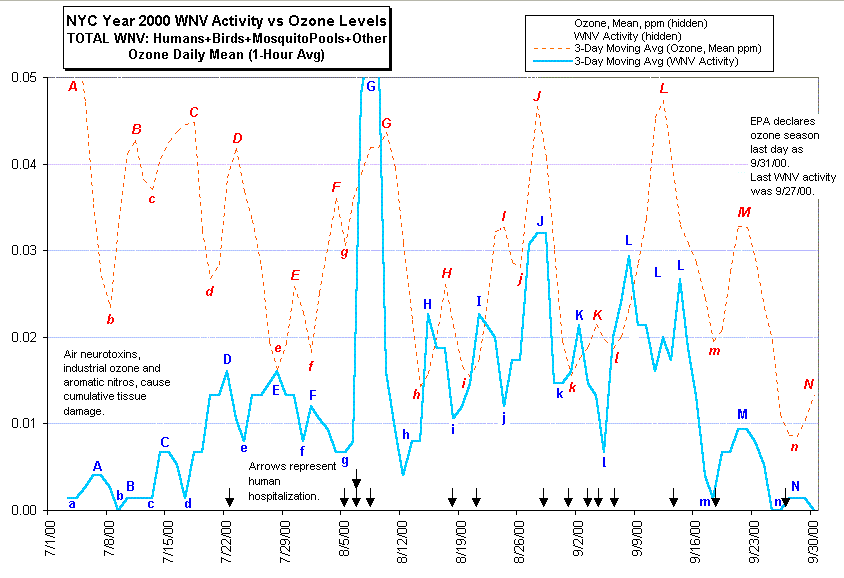
Every peak and valley (28 of them) is reflected in both lines. 9/12/00 is a bit of an exception, but it is a reasonable, temporary downward fluctuation. Perhaps Staten Island ran out of susceptibles, until the continued, sustained ozone levels affected the hardier. An explanation with available data is difficult, because the monitor is in Staten Island, and the WNV data is coming from all of NYC, though mostly Staten Island. Perhaps the 9/12/00 phenomena is the item referred to regarding the detail graph at the top of this page, the double WNV activity peak, often found associated with a single ozone peak.
The amplitude of the oscillations corresponds strongly: a:A with a:A, b:B with b:B, etc.
A WNV activity rise often occurs before or very quickly upon an ozone rise (see Graph 1). We can't say now that bird death causes neurotoxin levels, but that another very closely related phenomena has been revealed. This phenomena might be accounted for by aromatic nitros (which usually accompany industrial ozone). Although I haven't seen a study on "A Comparison Of The Various Transmission Rates For Air Neurotoxins", generally speaking, nitrogen compounds diffuse more quickly through their environment. Neurotransmitters, gastro-intestinal gases, amides (used in detergents) are bound to nitrogen.
A rebound pattern, consistently found at the ends of the oscillations, also explains early response of bird death. This rebound is also found in stock market readings, where large spikes in any direction (up or down) are followed by a quick but lesser "correction", a phenomena of mass movement. This gives the impression that the next activity is leading the correlating phenomena.
Ozone only accounts for a fraction of air neurotoxins. Another is particulate matter: http://www.nrdc.org/air/pollution/bt/5600.asp
The EPA, NYCDOH, and CDC need to trade in their high-tech equipment and their viropathologists for canaries, which could be monitored for behavior signs, not necessarily illness or death.
V. Cumulative Effects Of Ozone
Entire Summer/Statewide
Animal WNV activity, in terms of WNV positive animals for all of NYS is compared against the Susan Wagner monitor station ozone readings in the following graph:
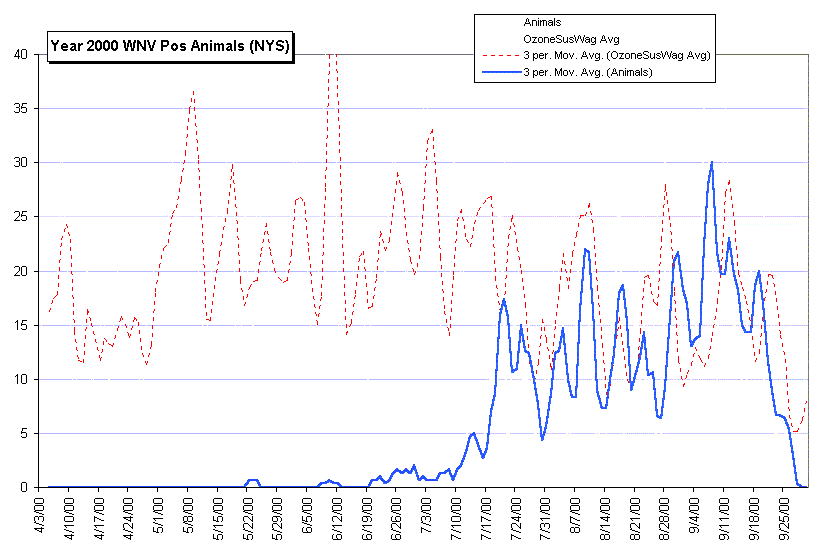
This graph demonstrates a rule of toxicology:
"...the toxicological rule that the product of the concentration multiplied by the time (CxT) results in a constant response." (G. K. Clemons and J. F. Garcia, Arch. Tox., Supp. 4, p301, 1980)
My review of wildlife refuge activity (little of which was reported as WNV-positive) finds an activity peak in early July, directly very closely with ozone levels. There is little accumulation effect.